CCS Week 2 - Past Climate Change
2.1 Ancient Climate Change
Here I attempt to summarise Dr. Tim Lenton’s video.
We have evidence for and theories describing how the Earth’s climate has changed over the past 4.5 billion years. Climate changes have happened slowly. The main effects come as the result of the interactions between two key systems: the carbon cycle and polar ice formation. Other significant contributions come from solar irradiation (light energy from the sun), and volcanic activity.
The carbon cycle
4.5 billion years ago, the sun released 25-30% less energy than today. Given the current atmospheric gas concentrations, that energy would allow the Earth’s surface to reach temperatures only as high as 20 degrees less than we experience today. However, the atmosphere contained much more carbon dioxide (CO2) and water vapour ( H2). Evidence suggests higher temperatures than today. The carbon cycle is thought to have reduced CO2 levels over time. Although the sun now gives off more energy than in the past, the greenhouse or blanket effect is lower, producing the habitable temperatures we now enjoy. Scientists view this as the planet self-regulating its temperature.
The carbon cycle follows carbon through various parts of the Earth’s crust. Carbon starts in the air as gasseous CO2. The gas dissoves in water and falls to the surface as carbonic acid. This disolves silicate based rocks, and the resuling bicarbonate solutions flow toward the seas. Once there, shellfish and crustacians use the bicarbonates to form their shells. When these animals die, they descend to the sea bed, and over time, their bodies form sedimentary, carbonate rocks.
Polar ice formation
The carbon cycle pulls carbon from the atmosphere and stores it in sedemantry rocks. This had the effect of reducing the greenhouse effect and hence surface temperatures. As a result, ice sheets would extend further away from their sources (most significantly the poles). The greater the surface area of the Earth covered in ice, the higher the Earth’s albedo. With this higher reflectance, less light energy gets converted into heat at the surface. This lowers the overall surface temperature and promotes further ice extension. Eventually, ice reached the tropics (around 30degrees latitude), setting off a tipping point. The process “ran away”, with ice reaching to the Equator creating a “Snowball Earth”.
We have evidence for two extreme ice ages, 2.2 billion and 700 million years ago, as well as shorter, less deep ones.
Coming out of ice ages
The ice sheets block the formation of aquatic animal shells, and hence of carbonate rocks. The final step of the carbon cycle happens when volcanic activity pushes carbon up into the atmosphere. During ice ages, this volcanic activity replenishes the atmospheric CO2. Eventually, this increases the greenhouse/blanket effect and the Earth’s surface temperature increases once again. The increased temperatures promote the ice to melt, which lowers albedo, producing a positive feedback cycle raising the temperature futher.
These two processes somewhat balance one another, but as has been seen with the ice ages, sometimes tend to one or other extreme.
Solar effects and an extreme greenhouse
We expect the sun to continue getting brighter. We understand this as a feature of star development. The developments happen increadibly slowly, slower still than geological changes. As the sun heats, so more water vapour will fill the atmosphere. This will heat the Earth’s surface, and accelerate this heating through positive feedback. Eventually a “pressure cooker”-like effect will render the Earth uninhabitable to life, much like present day Venus. Venus experiences significantly more radiation from the sun and has surface temperatures in the 100s of degrees.
2.2 Snowball Earth
I only have sketchy notes for this topic…
Cryongenian period 850 - 635m yrs ago
Dropstones in Namibia “The tropics cannot freeze”
Glaciation before: simple life forms after:
- no competiton
- more complex, larger, multi-cellular life now
- algae beneath glaciers, now
How did life remain under glaciers?
- suggestion that glaciers formed slowly, and thus clear - photosynthesis possible, plants sustainable…
What happened when glaciers melted?
- 100m tidal waves
- 100 yr long acid rain storms
- growing mountains (later, rock layers) of calcium carbonate formed when acid rain reacts with calcium rich rock
Runnaway glaciation
- happens because when ice flows extend to a certiain point, so much sunlight gets reflected that surface temperatures cannot rise again enough to melt any ice…
- Budyko suggested glaciers could entomb the Earth, permanently
- this seems counter to the suggested effect volcanic carbon emmissions; perhaps it was not considered at the time?
- no rain
“Snowball glaciation” seen as evolutionary jump-start.
2.3 Feedback diagrams
Negative feedback: temperature stablisation via carbon dioxide reduction
A negative feedback process within a system can cause the system to tend towards stability. In this example, global average surface temperatures remain reasonably steady, despite increasing irradiation as the sun ages and develops.
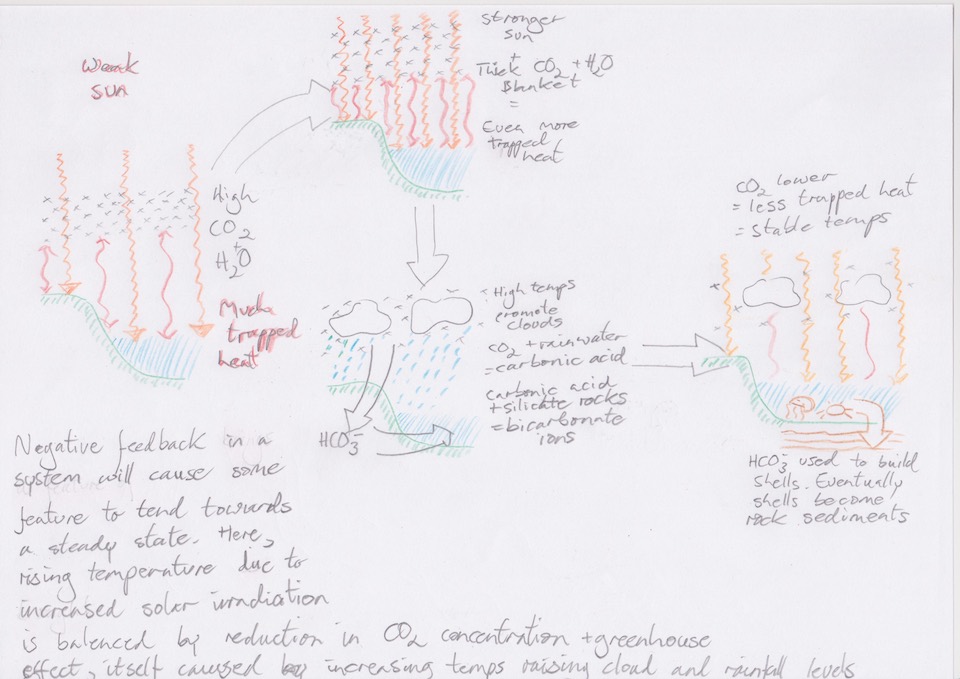
Stars age. The sun has grown from a cooler, younger phase. During this younger phase, the Earth had a thicker “blanket” of water vapour and carbon dioxide. This maintained a surface temperature equal or higher than experienced today. As the sun matured, it released more energy. The Earth’s blanket should have trapped this increased energy as heat. Instead, however, the heat promoted more evaporation of water vapour, which in turn lead to carbon dioxide being dissolved into rainwater at an increasing rate. Without the carbon dioxide, the temperatures stablised rather than rose.
Carbon from the atmosphere ended up in layers of rock. Dissolved in water, CO2 becomes cabonic acid. This reacts with silicate rocks, eroding them and resulting in hydrogen carbonate ions leaching into rivers and seas. Plant and animal life uses these ions: in particular, aquatic animals use it to form shells. Over time, as millions of these animals die, layers of carbonate debris builds up and forms layers of rock as sediments lay on top of one another.
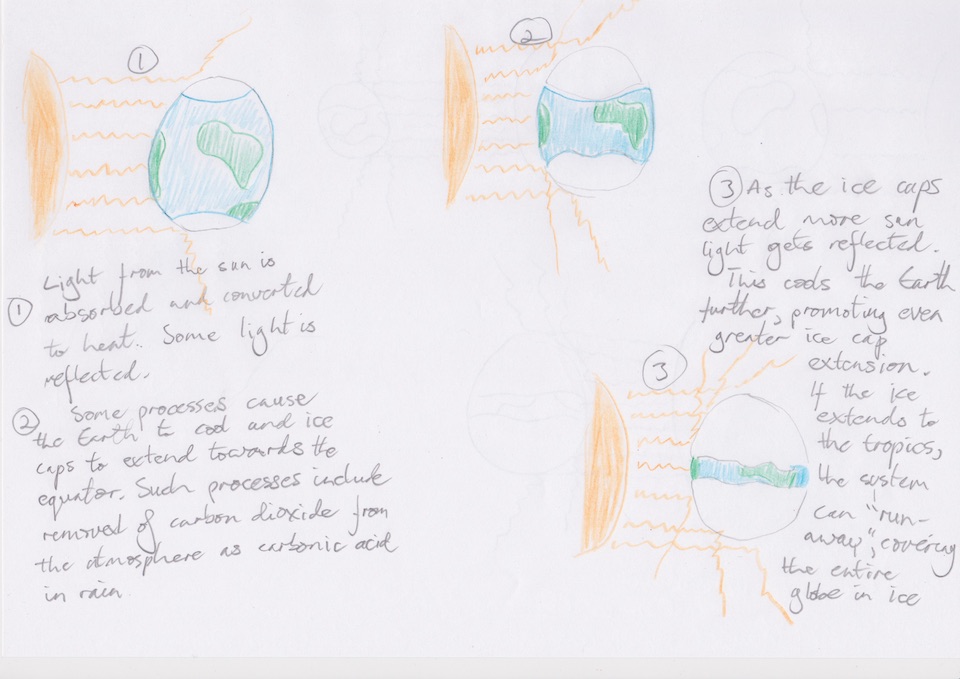
Postive feedback: increasing ice cap extensions
The negative feedback in the carbon cycle results in a lowering of the surface temperature.
This promotes extension of the ice caps. The greater the ice coverage, the higher the Earth’s albedo. As more light is reflected back to space, the planet can absorb less. This cools the surfuse further and promotes greater extension of the ice caps. The system tends positively towards greater ice cover (and lower temperatures). A proposed tipping point may accur when ice flows reach as far as the tropics. The albedo increae would lead to runaway temperature drops.
Diagram describing increasing ice cap extensions
2.4 Recent past climate changes
Varying climate regimes between 20,000 yrs ago and today.
For past 2.6 million years, changes over 1000s of years: predictable
- eccentricity (E) - shape of orbit changes over 100000 years between circular and eliptical. When more circular, Earth receives even solar irradiation; when elliptical Earth receives higher irradation in the near-to-sun portions of a year and less in the far-from-sun portions
- obliquity (T) - Axis of rotation varies between 21.5˚ and 24.5˚ over 41000 years; greater tilt provides more polar insolation during summer seasons (will this lead to warmer poles)
- procession (P) - over 23000 years the axis rotates like a spinning top; leads to changes in the timing of seasons. 11000 y/a Earths closest solar approach was accompanied by N.Hemisphere tilting towatds the sun (different from now? How?); lead to more seasonal climate variation
(factors attributed to Mullitin Malancovic (Serbian) )
Changes over 100s of years: less predictable.
- science has records of climatic changes over past several hundred years
- some from instruments (including, more recently, satalites)
- some from proxy records: ice cores and tree rings
Tree rings? Yes:
- photosynthesis produces wood around trunk of tree
- trees (especially deciduous ones) “wind down” photosynthesis in winter
- cycles of photosynthesis start/stop create marks in tree bark - “rings”
- space between rings indicates extent of growth and thus a proxy on temperature
- wider rings, more growth, higher temperatures
- bores taken with “incremental borer”
- count rings back from outer edge, step back in time
- compare with neighbours and also with trees from other populations
- can match some bores with slices of dead wood from bogs and forest floors, to “look further back in time”
- cross-dating
Data from cores can map changes in climate over time, but also suggests reasons for those changes. e.g.
- solar variability e.g. little ice age from 1400-to-now-ish
- volcanoes; short term and unpredicable effects on climate (generally cooling effects due to aerosol emmision raising earth albedo)
Reconstructred temperature data for past few thousand years shows variation, but that variation rests within a narrow range. The past 100-150 years records show significant rise in global average surface temperature (and water temperature at surface and depth): the hockey stick curve.
- inexplicable by solar variation nor volanism
Also CO2 concentration has risen alongside temperature changes.
We have records showing how naturally-created climate changes have caused humans to move, settlements to grow or become abandoned. These hint at possible human effect of current trend of temperature increases.
2.5 Climate change records
2.5.1 What are climate change records
Since the 1880s, scientists have been recording and sharing data on climate conditions around the world. This data comes from direct observation of the factors in question: temperature, rainfall, wind speeds and atmospheric gas concentrations. We have enough data to confidently describe climate patterns over this time
Researchers can also use other sources of data as proxies for climate factors. These sources of data come from observations of natural phenomena which change in response to variation in climate. For example: concentrations of gasses dissolved in ice, widths of rings in tree trunks, relative concentrations of isotopes in rock sediments.
Using proxy data, and models of intersecting factors, researchers can project a historical record of climate changes back across millenia.
2.5.2 How do volcanoes affect climate change?
The Earth’s molten core vents excess pressure through volcanoes. Pressure releases, or volcanic eruptions, can cover surrounding areas in many tonnes of molten rock, with ash and various gasses simulatniously hurled into the atmosphere.
The gasses from volcanic eruptions produce effects on the climate
- Aerosols and dust particles linger in the atmosphere for up to two years. During this time they act to cool surface temperatures by reflecting light from the sun back into space (they raise Earth’s albedo). As more light than usual gets reflected, the surface receives less energy, leaving it with less resource to convert into heat.
- Carbon dioxide (CO2) may remain in the atmosphere much longer (depending on the temperature and rainfall conditions of the time). Atmospheric CO2 produces a “greenhouse” or “blanket” effect, trapping heat close to the Earth’s surface. This raises the average surface temperatures.
2.5.3 How is today’s warming different from the past?
Today’s warming differs in two respcts:
- the warming can be shown to occur at [vastly increased rate][hockeystick] over preceeding decades and millenia (in fact the 20,000 years preceeding the last 150 have shown a gentle decreasing trend)
- the warming appears to occur in response to human factors rather than “natural” (non-anthropogenic) (with a roughly 97% confidence, according to the IPCC). The sharp upward trend coincides with a sharp increase in atmospheric CO2 concenrations. CO2 operates as a “greenhouse” gas, leading to warming surface teperatures. Human factors are thought largely reponsible for the increased CO2 concentrations.
2.5.4 What is the role of isotopes in determining temperatures from the past
Atoms of many elements occur with differing numbers of neutrons in their nuclei. Common, stable configurations of proton and neutron count have the name “isotopes”. Oxygen (O) has two: 16O and 18O. The differing atomic masses cause the atoms to behave slightly differently for a given set of conditions: e.g. the lighter 16O will evaporate faster than 18O for the same temperature.
Relative isotope concentrations in materials can give clues to the environment where the material formed. Many sea creatures build calcium carbonate shells and skeletons using cabonate ions from their local environment (i.e. carbonic acid and hydrogen carbonate ions in the water they inhabit). When the creatures die, their shells and skeletons pile up on the sea floor, eventually forming layers called sediments. Concentrations of isotopes in these layers will reflect conditions at the time the animals lived. Inspecting bore samples can produce data describing changes in environmental conditions over time.
Foraminifera, a microscopic shelled sea creature, have lived in vast quantities throughout the oceans and so make a sizeable contribution to this record.
The ratio of 18O to 16O, called δ18O in sediments of Foraminifera shells reflects the temperature of the water in which the creatures lived. Warmer temperatures lead to lower δ18O (presumably because the warmer water provides more energy to the dissolved molecules, the ligher δ16O move faster and are more likely to react with other chemicals, raising the chance of their uptake into animal’s bodies).
However, a complication makes this effect both harder to interpret: δ18O in animal structures will be higher when the environmental water concentrations are higher. Water temperatures and evaporation rates vary greatly around the globe, and so δ18O will vary around the globe. Models of water temperature and evaporation rates are needed to properly interpret the sediment data.
2.5.5 How have trees been used to reconstruct different climate variables across the world?
Trees convert sunlight into chemical energy and use this along with nutrients from the soil to grow. As solar irradiation varies through the year, due to seasonal shifts and the Earth’s proximity to the sun, rates of change of growth occur across the year. In some trees, growing even stops during winter months. These varying groth rates can be observed as ring-shaped patterns through the trunks of trees.
Taking a bore through the trunk of a tree allows scientists to inspect the layers of growth without felling the whole tree. The widths of bands through the bore reflect varying growth rates: roughly, wider bands mean more growth, implying greater irradiation. Counting bands or rings from the innermost to outermost ring allows researchers to count back through past years.
Taking samples from multiple trees in close population allows researchers to build up confidence in their analysys. Many trees showing similar patterns of growth act to confirm the record implied. Samples from disparate populations allow researchers to see how climate varied across geography.
2.5.6 How can ice cores provide a record of atmospheric composition?
Cores of ice drilled from glaciers can provide a record of numerous changes in cliamte and atmosphere. Like bands or rings in tree trunks, glaciers and ice fields are built up from years of layers. Years can be marked by changes in composition, because environmental conditions change through the year. Cores retrieved from deeper into the ice show records for periods earlier than cores from closer to the surface.
The cores show numerous features:
- gas concentrations of the atmosphere: some gasses dissolve in water (which turns to show), trapping a record of the concentrations at the time the layer was laid down
- airborn particles: volcanic ash, dust, pollen become trapped between snow crystals and embedded in the ice formed. Taking samples from connected, wide areas can show variations due to wind.
- environmental temperature: more snow will fall in colder years, leading to thicker layers
2.6 400 Parts Per Million
The course material states current atmospheric CO2 concentrations match those measured in records of the Pliocene Epoch. The notes invite us to compare those times with current times.
What caused the climate changes during the Pliocene?
Before the Pliocene, geologists define a longer epoch called the Miocene, and together these constitute the Neogene Era. Records (derrived from sediment and fossil samples, I assume ) show various climate changes across this whole era. The Miocene began 8˚C warmer than last century’s average, and ended 4”C warmer. The Pliocene continued this cooling trend averaging 2-3˚C warmer, but ending around -2˚C cooler than current averages (source).
Geologists think mid-latitude glaciation and establishment of recurrant polar ice cover began towards the end of the Pliocene. The now-familiar seasonal variations in temperature, wind and rainfall formed.
The North and South American land masses joined during this period. The join prevented mixing of Atlantic and (warmer) Pacific waters. This, and the polar ice cap formations promoted cold, shallow currents into the North atlantic and cold, deep currents into the South Atlantic. From my reading, these factors contribute most to the falling temperatures. Increasing planetary albedo due to growing polar ice extension would also make a noticable contribution, if CO2 concentrations had remained stable.
When do you think carbon dioxide levels in the Earth’s atmosphere will reach 450ppm
I lack the practical maths skills to work this out from data myself. The process would be to find the rate of increase in CO2 concentration (possibly including the rate of increase of the rate of increase), project that rate forwards through time until it meets 450 ppmv and the measure off the predicted year.
NOAA’s Earth System Research Laboratory creates and publishes data on several climate indicators, CO2 including emissions. Download the data up to 2015 here (via FTP).
The IPCC publish their findings, recommendations and data online. Their Data Distribution Centre has easily accessible (but low resolution) graphs showing climate indicator predictions according to various scenarios, from two data sets. I realised the easiest way to get a prediction was to inspect the raw data used to generate the graphs, conveniently linked from that page. Going on both the linked sets, I concluded an date of 2031 +/- 4years.
Reflect
What are the most important themes you have learned this week?
Feedback systems and how they can stablise or destablise the climate; the interaction of greenhouse gasses, precipitation and volanism on the climate and the carbon cycle; how varyious records and proxy records (historical documentation, tree cores, ice cores, coral and sediment structure and chemistry); the effects of climate changes on communities.
What aspect of this week did you find difficult?
Getting through the material on time. My perfectionist nature comes out when I am doing structured learning; and I also like to side-track myself. For example, I spent days trying to create animated simulations for the feedback diagrams (because ultimately I want to make this one of my core professional skills), but didn’t complete them. I used up most of my free time this week on those.
What did you find most interesting? And why?
The interaction of the carbon “cycle” with climate change. I like to understand things from a systems viewpoint.
Was there something that you learned this week that prompted you to do your own research?
The questions and reading about the Pliocene got me to look up a little more about the geological timeline.
The feedback diagram task prompted me, as mentioned above, to attempt to create animated diagrams in HTML & JavaScript. I want to do more work like this in future (and already have a career in web application development to lean on), but bit off more than I could chew with the simulations I tried to make. I aim to pursue this more in the future and already have ideas on how to improve my approach.
Are there any web sites or other online resource that you found particularly useful in furthering your knowledge and understanding?
- Wikipedia has great scientific summaries and very active contributers in this area. This page features a wonderful diagram showing relative durations of geological periods and facets of life - I found it completely engrossing!
- the Earth System Research Lab and IPCC Data Distribution Centre sites
- CO2 Earth - a site monitoring atmospheric CO2 conditions
- The World Bank’s CO2 emissions page